This blog explains popular candlestick patterns and how traders use them to predict market direction, spot reversals, and identify high-probability trade setups.
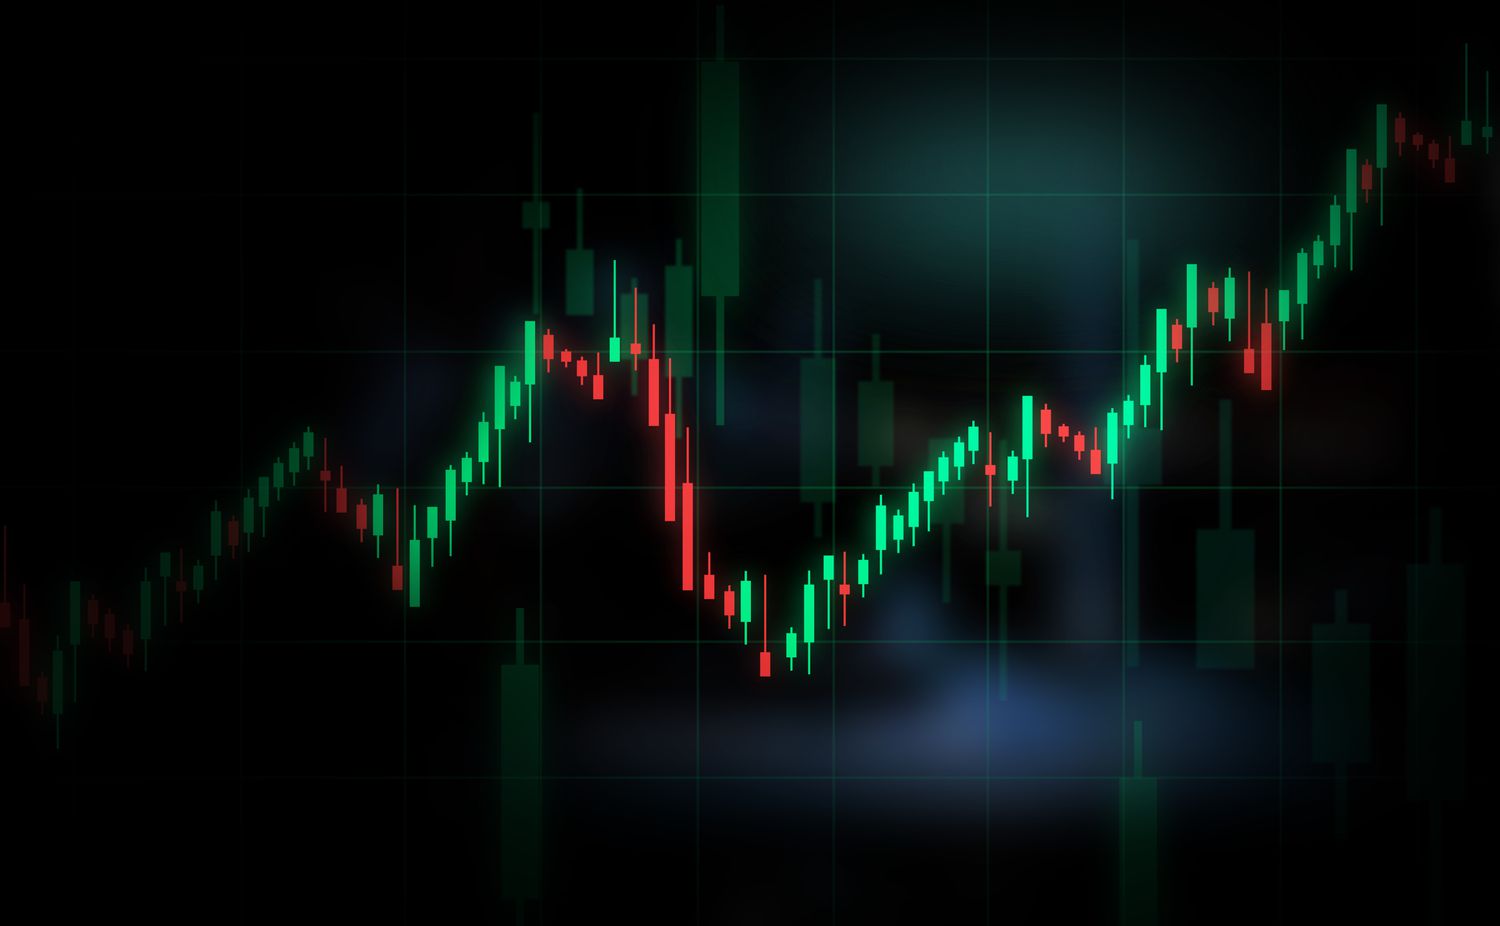
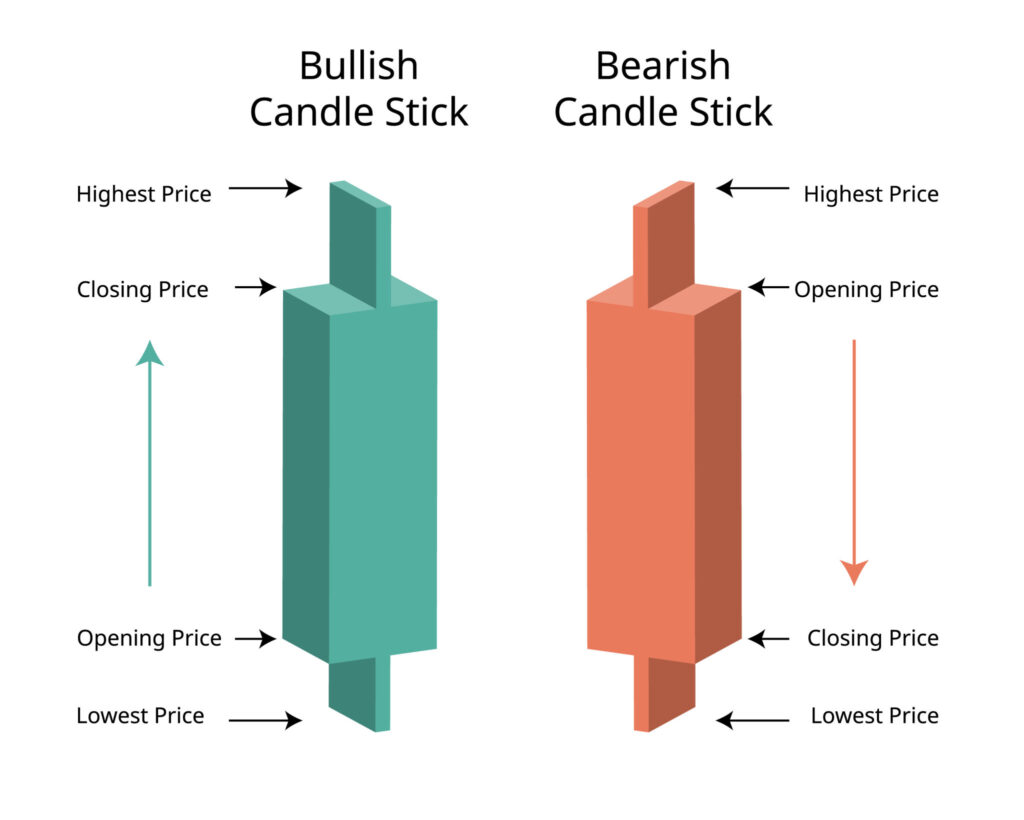
Candlestick charts are one of the most powerful tools in a trader’s arsenal. They visually represent market data and provide crucial insights into market sentiment. This blog explains the components of a candlestick: the body, the wick, and the color, and how these features reflect the buying and selling pressure in the market. It also explores common candlestick patterns, such as doji, engulfing, and hammer, that signal potential price reversals. By understanding these patterns, traders can make more accurate predictions about price direction and timing. This guide is ideal for traders looking to improve their chart-reading skills and gain an edge in the market.